Plotting Graph Tortuosity
One of the quantities of interest in the flow through porous media is not the properties of the matrix, but rather the properties of the corresponding pore space. In particular, there may be narrow passages called pore throats separated by wider, winding passages. Reduced pore throats and increased tortuosity often result in increased capillary pressure and a reduction in permeability.
For analysis purposes, you can plot the distribution of graph tortuosity and throat-weighted tortuosity between input and output boxes. Tortuosity is a measure of the departure of a pore space from an ideal system made of straight and parallel capillaries and can be defined as the ratio of actual path length to the straight distance between the ends of the path. Pore throats are defined as the smallest cross-sectional area of a pore channel, equal to the radius of a circle drawn perpendicular to fluid flow at the narrowest point.
Histograms of tortuosity and throat-weighted tortuosity

The tools at the top of the Histogram dialog let you to pan, zoom, and reset the histogram, as well as save the figure, adjust the figure, and export the histogram data to a comma-separated values file (*.csv extension).
|
|
Description | |
|---|---|---|
|
Pan |
|
Pans or zooms the figure as follows:
|
|
Zoom |
|
Zooms in or out on the figure, as follows:
|
|
Reset |
|
Resets the original view of the figure. |
|
Save |
|
Saves the figure as an image. Figures can be saved as a bitmap image in the JPEG, PNG, and TIFF file formats, as a vector graphic in the EPS or SVG file formats, or in the PDF file format. The figure can also be saved as raw data or in PG code for LaTeX. |
|
Settings |
|
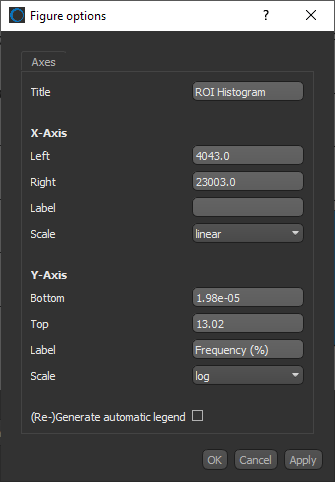
Opens the Figure options dialog, shown below.
You can edit the figure title, as well as choose a range, label, and scale for the X and Y axes, as follows:
|
|
Export to CSV |
|
Exports the histogram data to a comma-separated values file (*.csv extension), |
- Add box shapes to define the input and output of the segment of the graph that you want to plot (see Adding and Editing Shapes).
You can adjust the input and output boxes on the 3D view showing the graph or to the 2D views of the original region of interest, as shown below.

- Right-click the graph in the Data Properties and Settings panel and then choose Plot Graph Tortuosity in the pop-up menu.
- Choose the input and output boxes, as shown below.
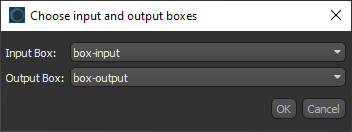
- Click OK to plot the tortuosity within the selected segment of the graph.

- Add box shapes that define the input and output of the segment of the graph that you want to plot (see Adding and Editing Shapes).
You can add the input and output boxes to the 3D view showing the graph or to the 2D views of the original region of interest, as shown below.
- Right-click the graph in the Data Properties and Settings panel and then choose Plot Graph Throat-Weighted Tortuosity in the pop-up menu.
- Choose the graph region of interest, as well as the input and output boxes, as shown below.
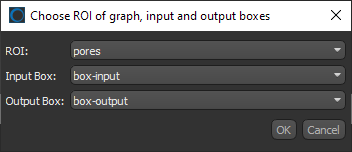
Note Throat-weighted tortuosity is sensitive to the spatial resolution of the region of interest under investigation.
- Click OK to plot the tortuosity within the selected segment of the graph.


